
Milestone Trend Analysis (MTA) is a project management tool tracking milestones at regular reporting dates to detect project delays early. For example, It was also used NASA’s Ranger programm, see this report on page 376. MTA can be a useful tool to communicate project status and progress with management. To perform MTA myself, I wrote this python function that creates the typical MTA visualization from a pandas dataframe using matplotlib:
from typing import List
import pandas as pd
import datetime as dt
import matplotlib.pyplot as plt
import matplotlib.dates as mdates


def mta_plot(
    df: pd.DataFrame,
    cols: List[str] = None,
    title: str = None,
    grid: bool = True,
    today_indicator: dt.date = None,
    xdate_locator: mdates.DateLocator = None,
    ydate_locator: mdates.DateLocator = None,
    xdate_formatter: mdates.DateFormatter = None,
    ydate_formatter: mdates.DateFormatter = None,
    **fig_kw,
) -> plt.Figure:
    """Milestone Trend Analysis Plot"""
    if cols is None:
        cols = ["Milestone", "Report date", "Estimated end date"]
    col_label, col_report_date, col_end_date = cols

    df[[col_report_date, col_end_date]] = df[[col_report_date, col_end_date]].apply(pd.to_datetime)

    # create empty figure with axes
    fig, ax = plt.subplots(1, 1, **fig_kw)

    # setup axis tick format for dates
    default_date_locator = mdates.WeekdayLocator(byweekday=4)
    default_date_formatter = mdates.DateFormatter("%Y-%m-%d, CW%V %a")
    if xdate_locator is None:
        xdate_locator = default_date_locator
    if ydate_locator is None:
        ydate_locator = default_date_locator
    if xdate_formatter is None:
        xdate_formatter = default_date_formatter
    if ydate_formatter is None:
        ydate_formatter = default_date_formatter
    ax.xaxis.set_major_locator(xdate_locator)
    ax.xaxis.set_major_formatter(xdate_formatter)
    ax.yaxis.set_major_locator(ydate_locator)
    ax.yaxis.set_major_formatter(ydate_formatter)

    # plot dates
    for mlst in df[col_label].unique():
        x = df[df[col_label] == mlst][col_report_date]
        y = df[df[col_label] == mlst][col_end_date]
        ax.plot(x, y, ".-", label=mlst)

    # set axes limits
    dates = pd.concat((df[col_report_date], df[col_end_date]))
    min_date = dates.min()
    max_date = dates.max()
    fst_date = min_date - dt.timedelta(days=7)
    lst_date = max_date + dt.timedelta(days=7)
    lims = [fst_date, lst_date]
    ax.set_xlim(lims)
    ax.set_ylim(lims)

    # put date ticks left and on top
    ax.tick_params(top=True, labeltop=True, bottom=False, labelbottom=False)

    # rotate xticklabels on top
    for xlabel in ax.get_xticklabels(which="major"):
        xlabel.set(
            rotation=50,
            rotation_mode="anchor",
            horizontalalignment="left",
            verticalalignment="center",
        )
    # ax.set_xticks(x.unique(), x.unique(), rotation=50, rotation_mode='anchor', va="center", ha="left")
    # ax.set_yticks(y)

    # add axis diagonal identity (x=y) line
    xmin, xmax = ax.get_xlim()
    ymin, ymax = ax.get_ylim()
    ax.axline([xmin, ymin], [xmax, ymax], color="black")

    # hide axis below identidy line
    ax.spines["right"].set_visible(False)
    ax.spines["bottom"].set_visible(False)

    # add legend
    ax.legend(loc="lower right")

    # add title
    if title:
        ax.set_title(title)
    else:
        now = dt.datetime.now()
        today_str = dt.datetime.strftime(now, "%a %Y-%m-%d CW%V")
        ax.set_title(f"Milestone Trend Analysis, {today_str}")

    # add today indicators
    if today_indicator is None:
        today_indicator = dt.date.today()
    if today_indicator:
        ax.vlines(today_indicator, today_indicator, ymax, color="gray", linestyle="--")
        ax.hlines(today_indicator, xmin, today_indicator, color="gray", linestyle="--")
        ax.text(
            today_indicator,
            today_indicator,
            f"Today: {today_indicator}",
            ha="left",
            va="top",
        )

    # add grid lines
    if grid:
        for xtick in ax.get_xticks():
            ax.vlines(xtick, xtick, ymax, color="gray", linestyle="-", linewidth=0.25)
        for ytick in ax.get_yticks():
            ax.hlines(ytick, xmin, ytick, color="gray", linestyle="-", linewidth=0.25)

    # finalize layout
    # fig.autofmt_xdate()
    fig.tight_layout()

    return fig
Input is a data frame of minimum three columns giving the milestone name (label), the report date and the milestone’s estimated end date at the report dates, like in this example:
| Milestone | Report date | Estimated end date |
|---|---|---|
| Milestone 1 | 2024-05-01 | 2024-06-10 |
| Milestone 2 | 2024-05-01 | 2024-07-10 |
| Milestone 3 | 2024-05-01 | 2024-08-10 |
| Milestone 4 | 2024-05-01 | 2024-09-10 |
| Milestone 1 | 2024-05-08 | 2024-06-17 |
| Milestone 2 | 2024-05-08 | 2024-07-10 |
| Milestone 3 | 2024-05-08 | 2024-08-10 |
| Milestone 4 | 2024-05-08 | 2024-09-10 |
| Milestone 1 | 2024-05-15 | 2024-06-17 |
| Milestone 2 | 2024-05-15 | 2024-07-03 |
| Milestone 3 | 2024-05-15 | 2024-08-10 |
| Milestone 4 | 2024-05-15 | 2024-09-10 |
| Milestone 1 | 2024-05-22 | 2024-06-17 |
| Milestone 2 | 2024-05-22 | 2024-07-03 |
| Milestone 3 | 2024-05-22 | 2024-09-10 |
| Milestone 4 | 2024-05-22 | 2024-09-10 |
| Milestone 1 | 2024-05-29 | 2024-06-17 |
| Milestone 2 | 2024-05-29 | 2024-07-03 |
| Milestone 3 | 2024-05-29 | 2024-09-10 |
| Milestone 4 | 2024-05-29 | 2024-09-10 |
| Milestone 1 | 2024-06-05 | 2024-06-17 |
| Milestone 2 | 2024-06-05 | 2024-07-03 |
| Milestone 3 | 2024-06-05 | 2024-09-10 |
| Milestone 4 | 2024-06-05 | 2024-10-20 |
| Milestone 1 | 2024-06-12 | 2024-06-17 |
| Milestone 2 | 2024-06-12 | 2024-07-03 |
| Milestone 3 | 2024-06-12 | 2024-09-10 |
| Milestone 4 | 2024-06-12 | 2024-10-20 |
| Milestone 1 | 2024-06-19 | 2024-06-17 |
| Milestone 2 | 2024-06-19 | 2024-07-03 |
| Milestone 3 | 2024-06-19 | 2024-09-10 |
| Milestone 4 | 2024-06-19 | 2024-10-20 |
| Milestone 1 | 2024-06-26 | 2024-06-17 |
| Milestone 2 | 2024-06-26 | 2024-07-03 |
| Milestone 3 | 2024-06-26 | 2024-09-10 |
| Milestone 4 | 2024-06-26 | 2024-10-20 |
Path to download “mta_example.csv”
Here are two example usages and the resulting plots for the above table.
df = pd.read_csv("mta_example.csv")First using the mta_plot with its defaults arguments:
mta_plot(df).show()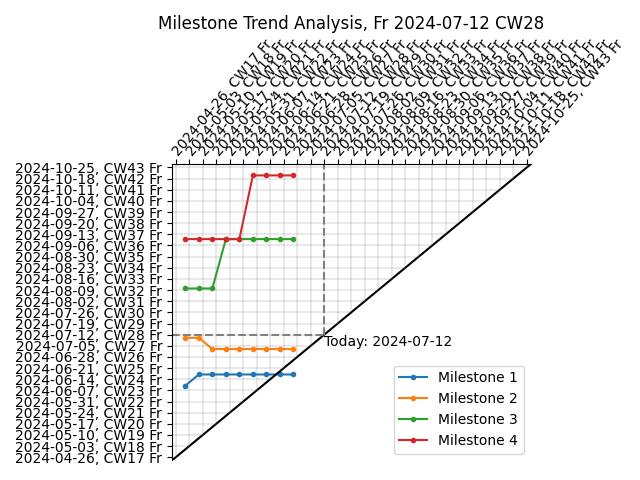
…and second, using the mta_plot with some specified keyword arguments:
mta_plot(
    df,
    grid=False,
    today_indicator=dt.date(2024, 5, 31),
    title="Hello World",
    figsize=(15, 12),
).show()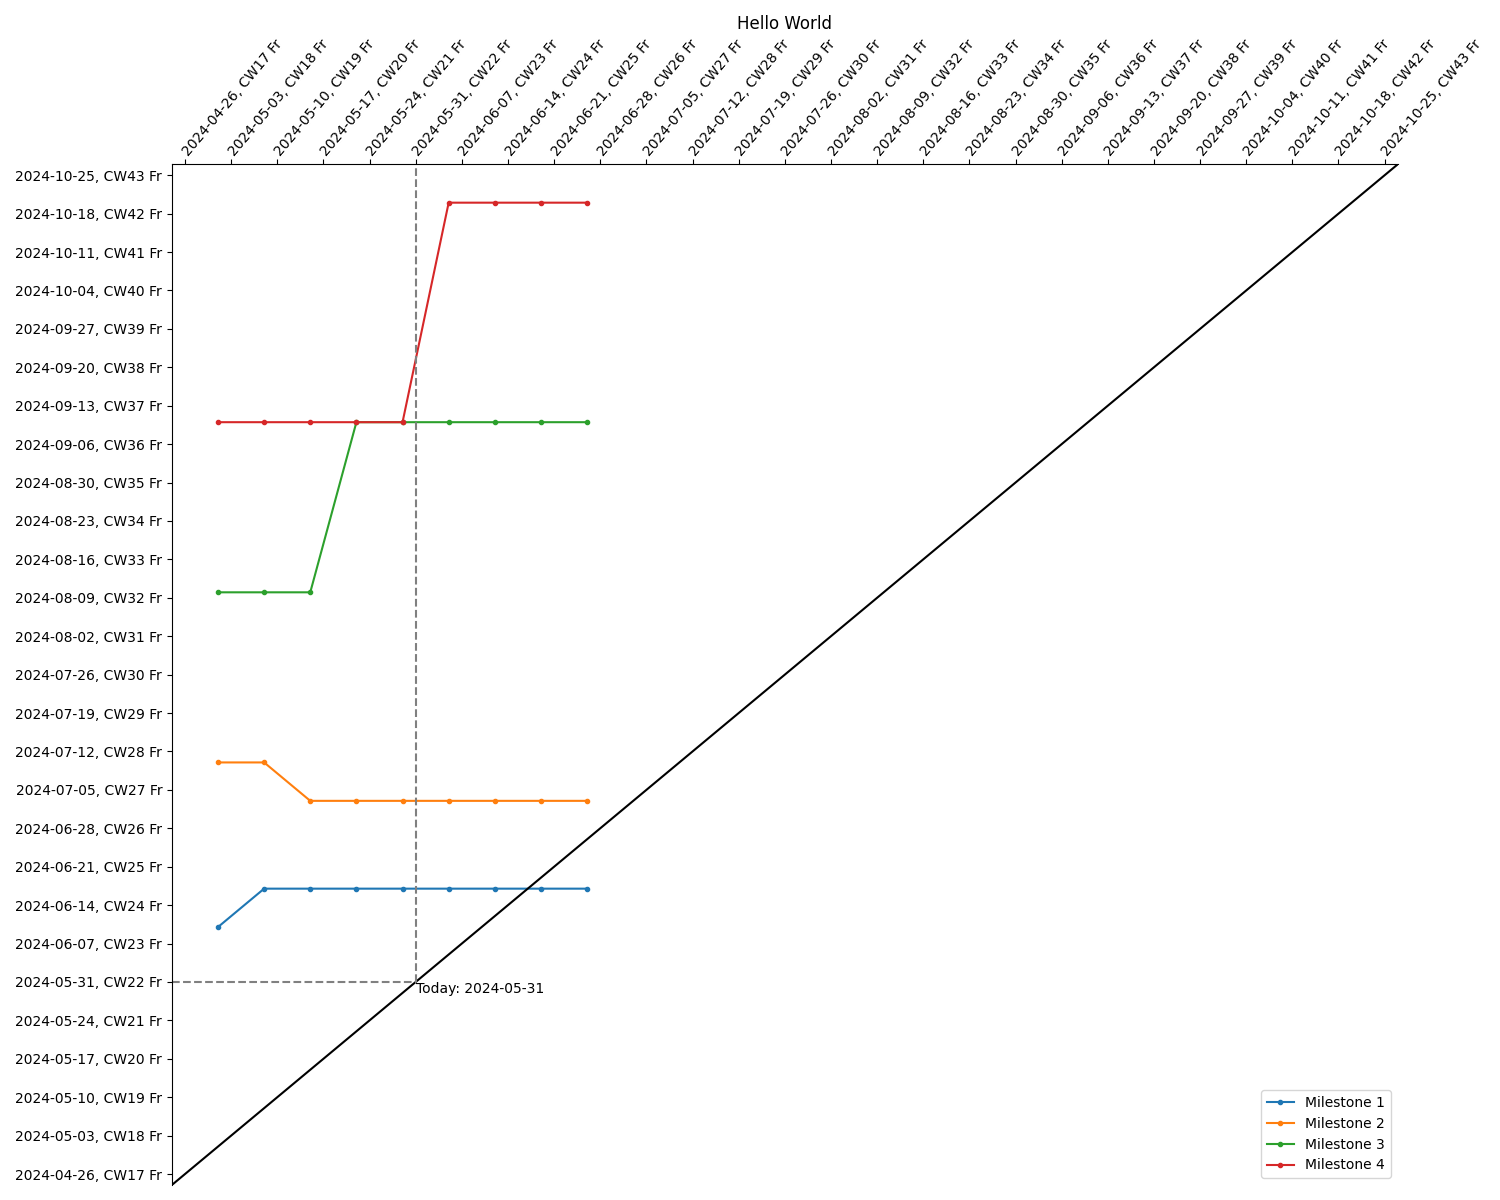
Next post, I use this function in an org file.